Note
Go to the end to download the full example code.
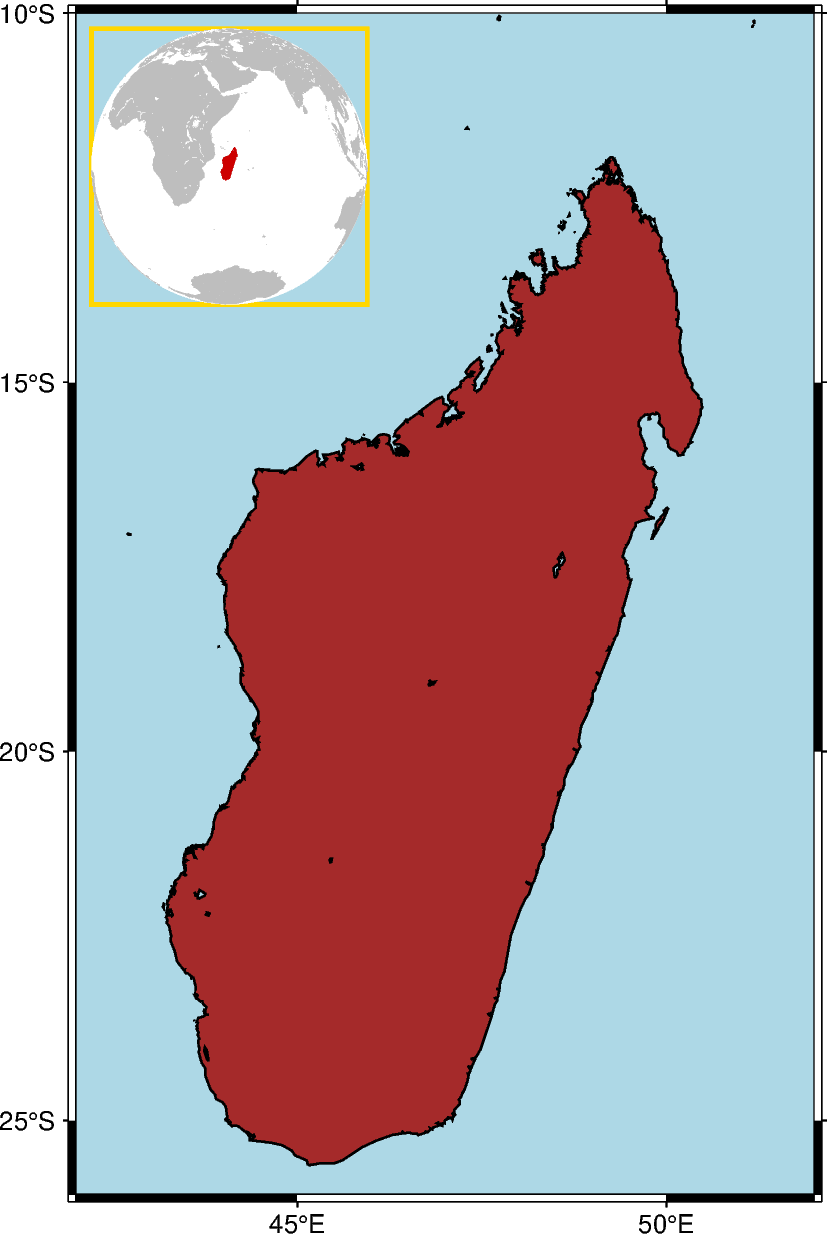
Inset
The pygmt.Figure.inset method adds an inset figure inside a larger figure. The
method is called using a with statement. Plotting methods called within the with
statement are applied to the inset figure.
import pygmt
from pygmt.params import Axis, Box, Position

fig = pygmt.Figure()
# Create the primary figure, setting the region to Madagascar
fig.basemap(region="MG+r2", projection="M12c", frame=Axis(annot=True))
# Set the land color to "brown", the water color to "lightblue", and the shorelines
# width to "thin"
fig.coast(land="brown", water="lightblue", shorelines="thin")

# Create an inset, placing it in the Top Left (TL) corner with a width of 3.5 cm and x-
# and y-offsets of 0.2 cm. The clearance is set to 0, and the border is "gold" with a
# pen thickness of 1.5 points.
with fig.inset(
    position=Position("TL", offset=0.2),
    width=3.5,
    clearance=0,
    box=Box(pen="1.5p,gold"),
):
    # Create a map within the inset. This example uses the azimuthal orthogonal
    # projection centered at 47 E, 20 S. The question mark is required for the
    # automatic size determination by PyGMT
    fig.basemap(region="g", projection="G47/-20/?", frame=0)
    # Madagascar is highlighted in "red3"
    fig.coast(land="gray", water="white", dcw="MG+gred3")
fig.show()
Total running time of the script: (0 minutes 0.630 seconds)